Why Dashboards & Analytics for Your Reporting and Analytics Program?
Company leaders at all levels need real-time visibility of EHS and sustainability data and analytics from across the enterprise, so they can react quickly and measure the success of program initiatives.
Simplify Data Management
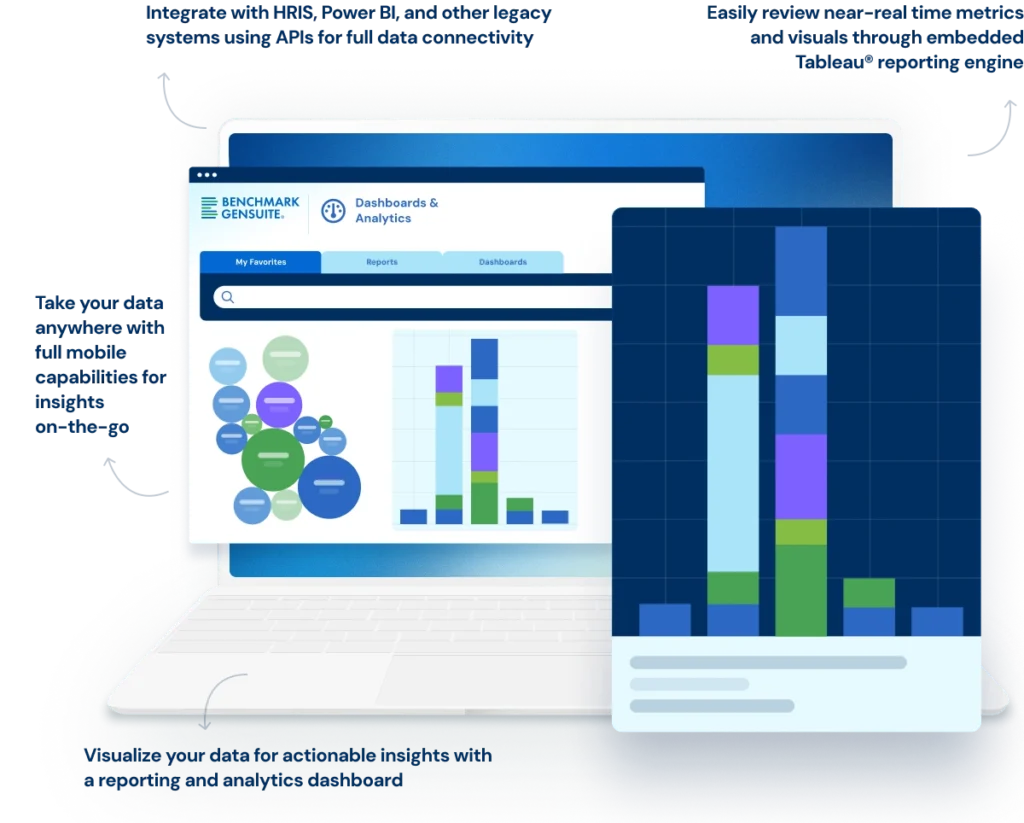
Easily review near-real-time metrics and visuals through the embedded Tableau® reporting engine.
Streamline Reporting
Facilitate timely action and reduce operating burdens.
Boost Efficiency
Save time with pre-designed template reports and data sets for core applications.
Enable Actionable Insights
Identify trends using predictive analytics to improve decision making based on data and risk tolerances.
Build Customized Analytics
Create your own at-a-glance views with customizable analytics and visualization displays.
Features & Benefits
Take Charge of Your Data and Drive Continuous Improvement
No matter how complex or widespread your operations, you can count on accurate, timely, actionable insights to help drive better business outcomes.
Drive Data-Backed Improvements
Comprehensive data collection and performance analytics provide big-picture insights into trends, underlying causes, and risk factors.
Consolidate Disparate Data
Use data warehouse connections to analyze data from multiple applications or systems for in-depth reporting and analysis.
Share Insights and Intelligence
Easily generate and share personalized dashboards, organizational metrics, and KPI reports to visualize performance benchmarking.
Take Your Program to the Next Level with
AI &Tech Solutions
Our Reporting & Analytics/Dashboards solutions seamlessly integrate with these AI and tech solutions to increase your insights and maximize your impact.
Seamlessly integrate, transform, and publish data across your organization & Benchmark Gensuite solutions.
Benchmark Gensuite Mobile
Connect on the go for functionality and flexibility wherever work is— from the office to the field.
Genny®
Tap, type, or speak to our dedicated virtual assistant for simplified support, user access, and an enhanced user experience.
See What People are Saying
"To me, the Dashboards & Analytics application has had the most impact. We started utilizing it with Data Warehouse and the supporting Tableau feature. We have two fantastic storyboards stored there. These storyboards provide a view of the applications we are currently utilizing."
"Dashboards and Analytics is my favorite app because I'm a visual person. We really appreciate the support we received from the Benchmark Gensuite team while we customized our platform."
Mary Ann Polad Director, EHS, Security, & Sustainability Boston Beer
"Tableau and Analytics for me is a huge benefit. So I don't have to sit there and make these dashboards and charts each month. It is a blessing that you guys integrated with Tableau."
Kimberly Hodges Project Manager, WestRock

“We love the storyboards. It’s a great way to create multiple dashboards using a multitude of charts to display our key data.”